
AboutFevo Analytics 2.0
Fevo Analytics was a part of a bigger picture: WeFevo, which included other services such as Vendor Agreement, Vendor Settings, Creation Flow, Invenotry, Templates and etc. We worked hard as a team to make sure our clients have access to the latest metrics, so as a result, they can build a better business and achieve goals faster.
⚠ Disclaimer: Please be advised that this project contains sensitive information, and some parts of the details might be hidden. If you have specific questions regarding my process, please contact me.
RoleLead Product Designer: I was in charge of rebuilding WeFevo (B2B, B2C platform), where Analytics was an essential part of it.
Skills: quantitative and qualitative UX research, persona, data, analytics, field research, competitor analysis, user interviews, affinity mapping, user scenarios, observational study, storyboarding, scenario mapping, usability testing, user-centered approach
Tools: sketch, abstract, photoshop, invision, protopie, MIRO, whiteboarding
So, What’s the Problem?
Actually, we had a few. For instance, we knew that our competitors have comprehensive analytics, in that they allowed the end-user to build out the reports, dashboards based on parameters they felt was necessary. Since we were dealing with anything from MLB, to college sports, to some concerns… reports always had different needs and/or intentions. From our Business Success team, that some of our clients are missing some critical metrics in the current analytics. Also, one of the problems was the average NPS and loading time for generating reports. Manager’s pain point was to encourage reps to sell more tickets.
The Team
As always, the best part to work on complex projects is the best team! I was lucky to work with one of the most talented engineers, product managers, designers, scrum masters, marketing, and business success people.


Francis Pelland, VP of Platform and Operations at Fevo
“Mikhail is an absolute pleasure to work with! At Fevo, we worked together on the analytics system, which was intended to serve a very diverse demographic… Mikhail was able to distil (sometimes crazy) ideas and apply them to his thought process and design. The end result was simple, beautiful and a game changer for reporting sales.”
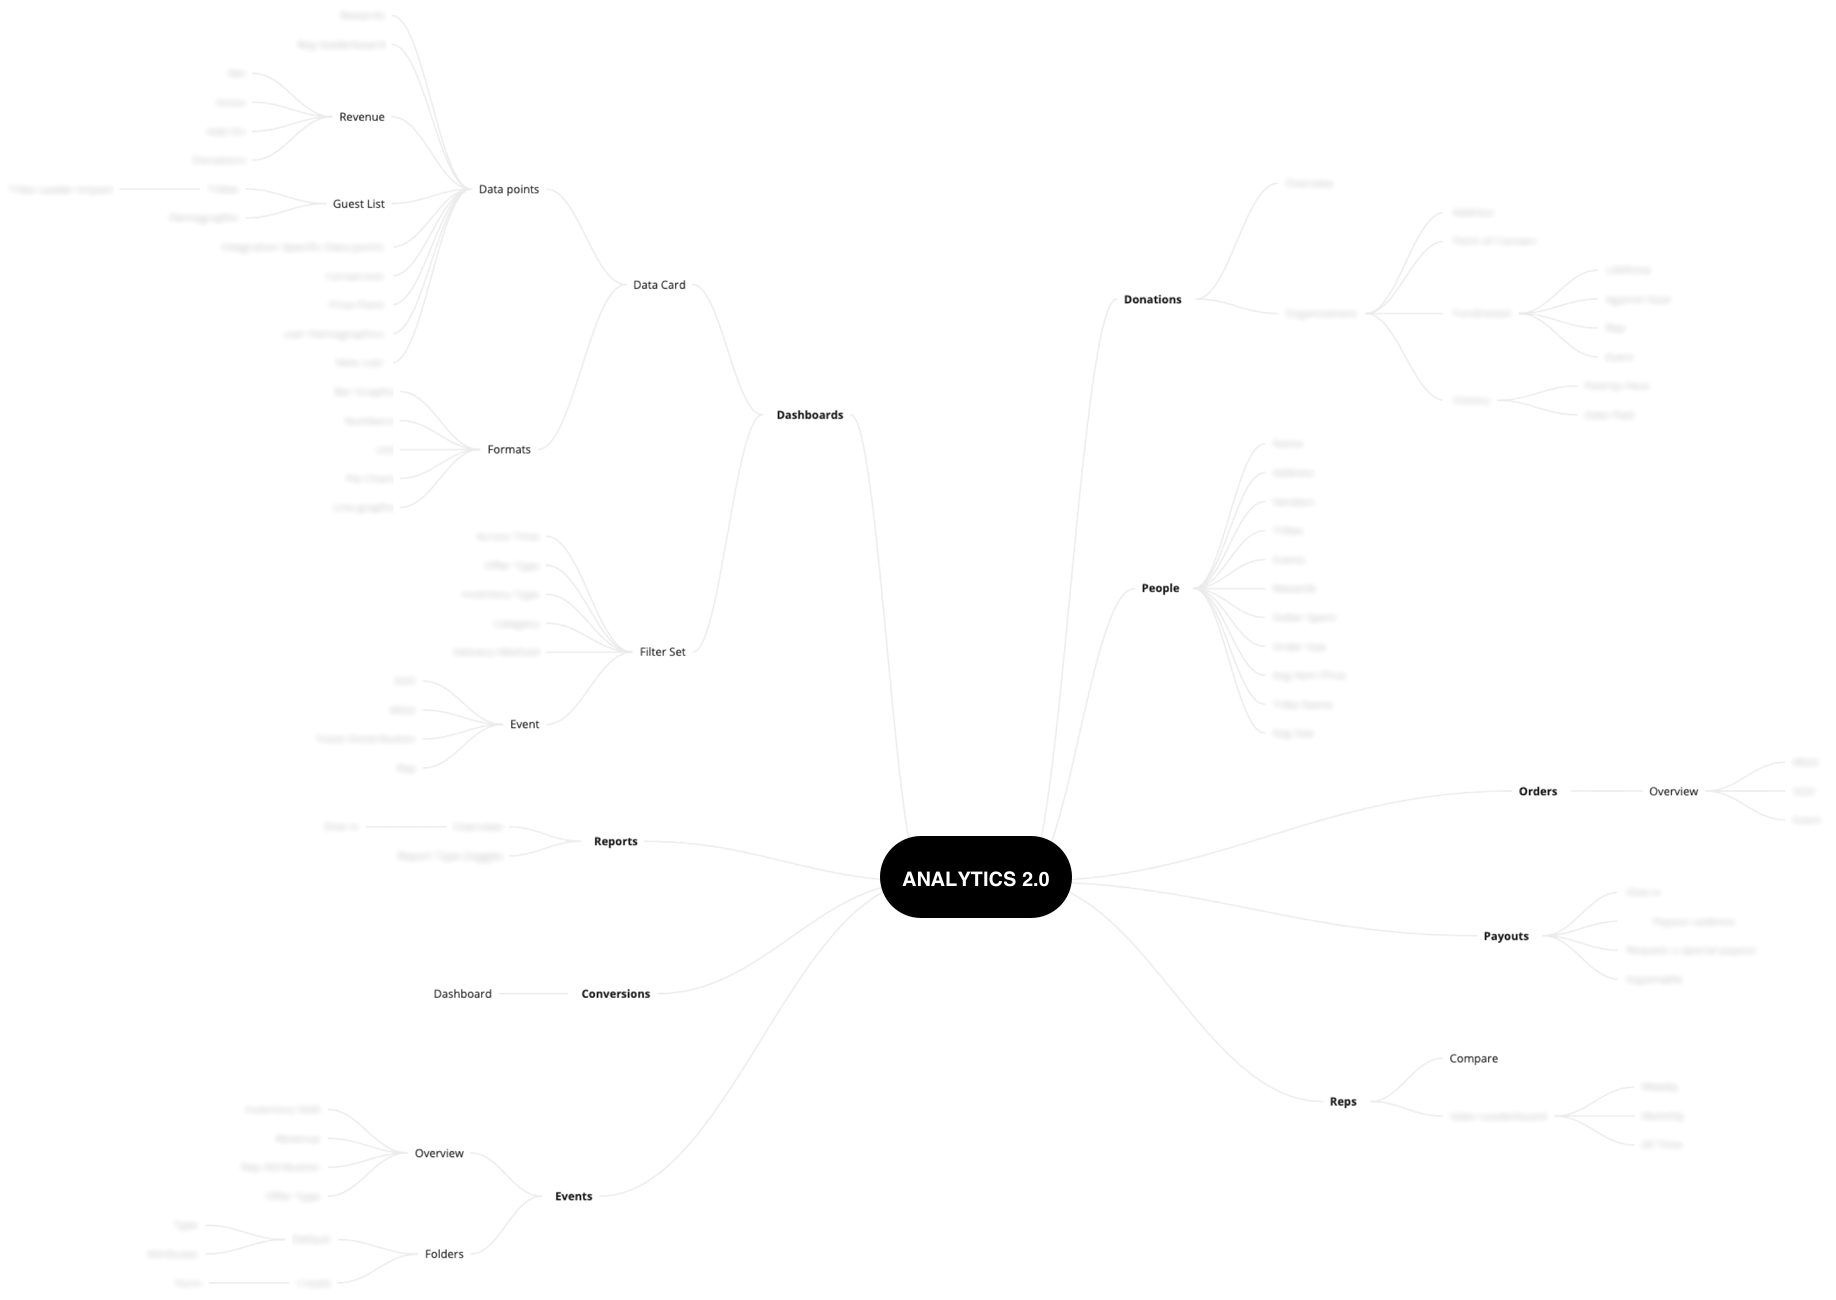
INFORMATION ARCHITECTUREExtracting Data and Core Features
Before starting working on the Analytics, we analyzed with the team the structure of the current analytics and “future” possible analytics
Current

Implied
Based on available metrics

DISCOVERQualitative & Quantitative UX Research
The goal of quantitative and quantitative UX research was to get insights about our clients, what are their motivations for using our internal tools? How do they react to it? What do they like and dislike about specific features? Through patterns in the data, I was able to gain insights about the intent of people’s product usage measured by surveys.
EMPATHYField Study, Persona, User Journey
Understanding users — their motivations, their experiences, and how the product fits into their life — is critically important. I’ve done field research with my team at Prudential Center: meeting clients in their field and direct observation helped validate & support findings.

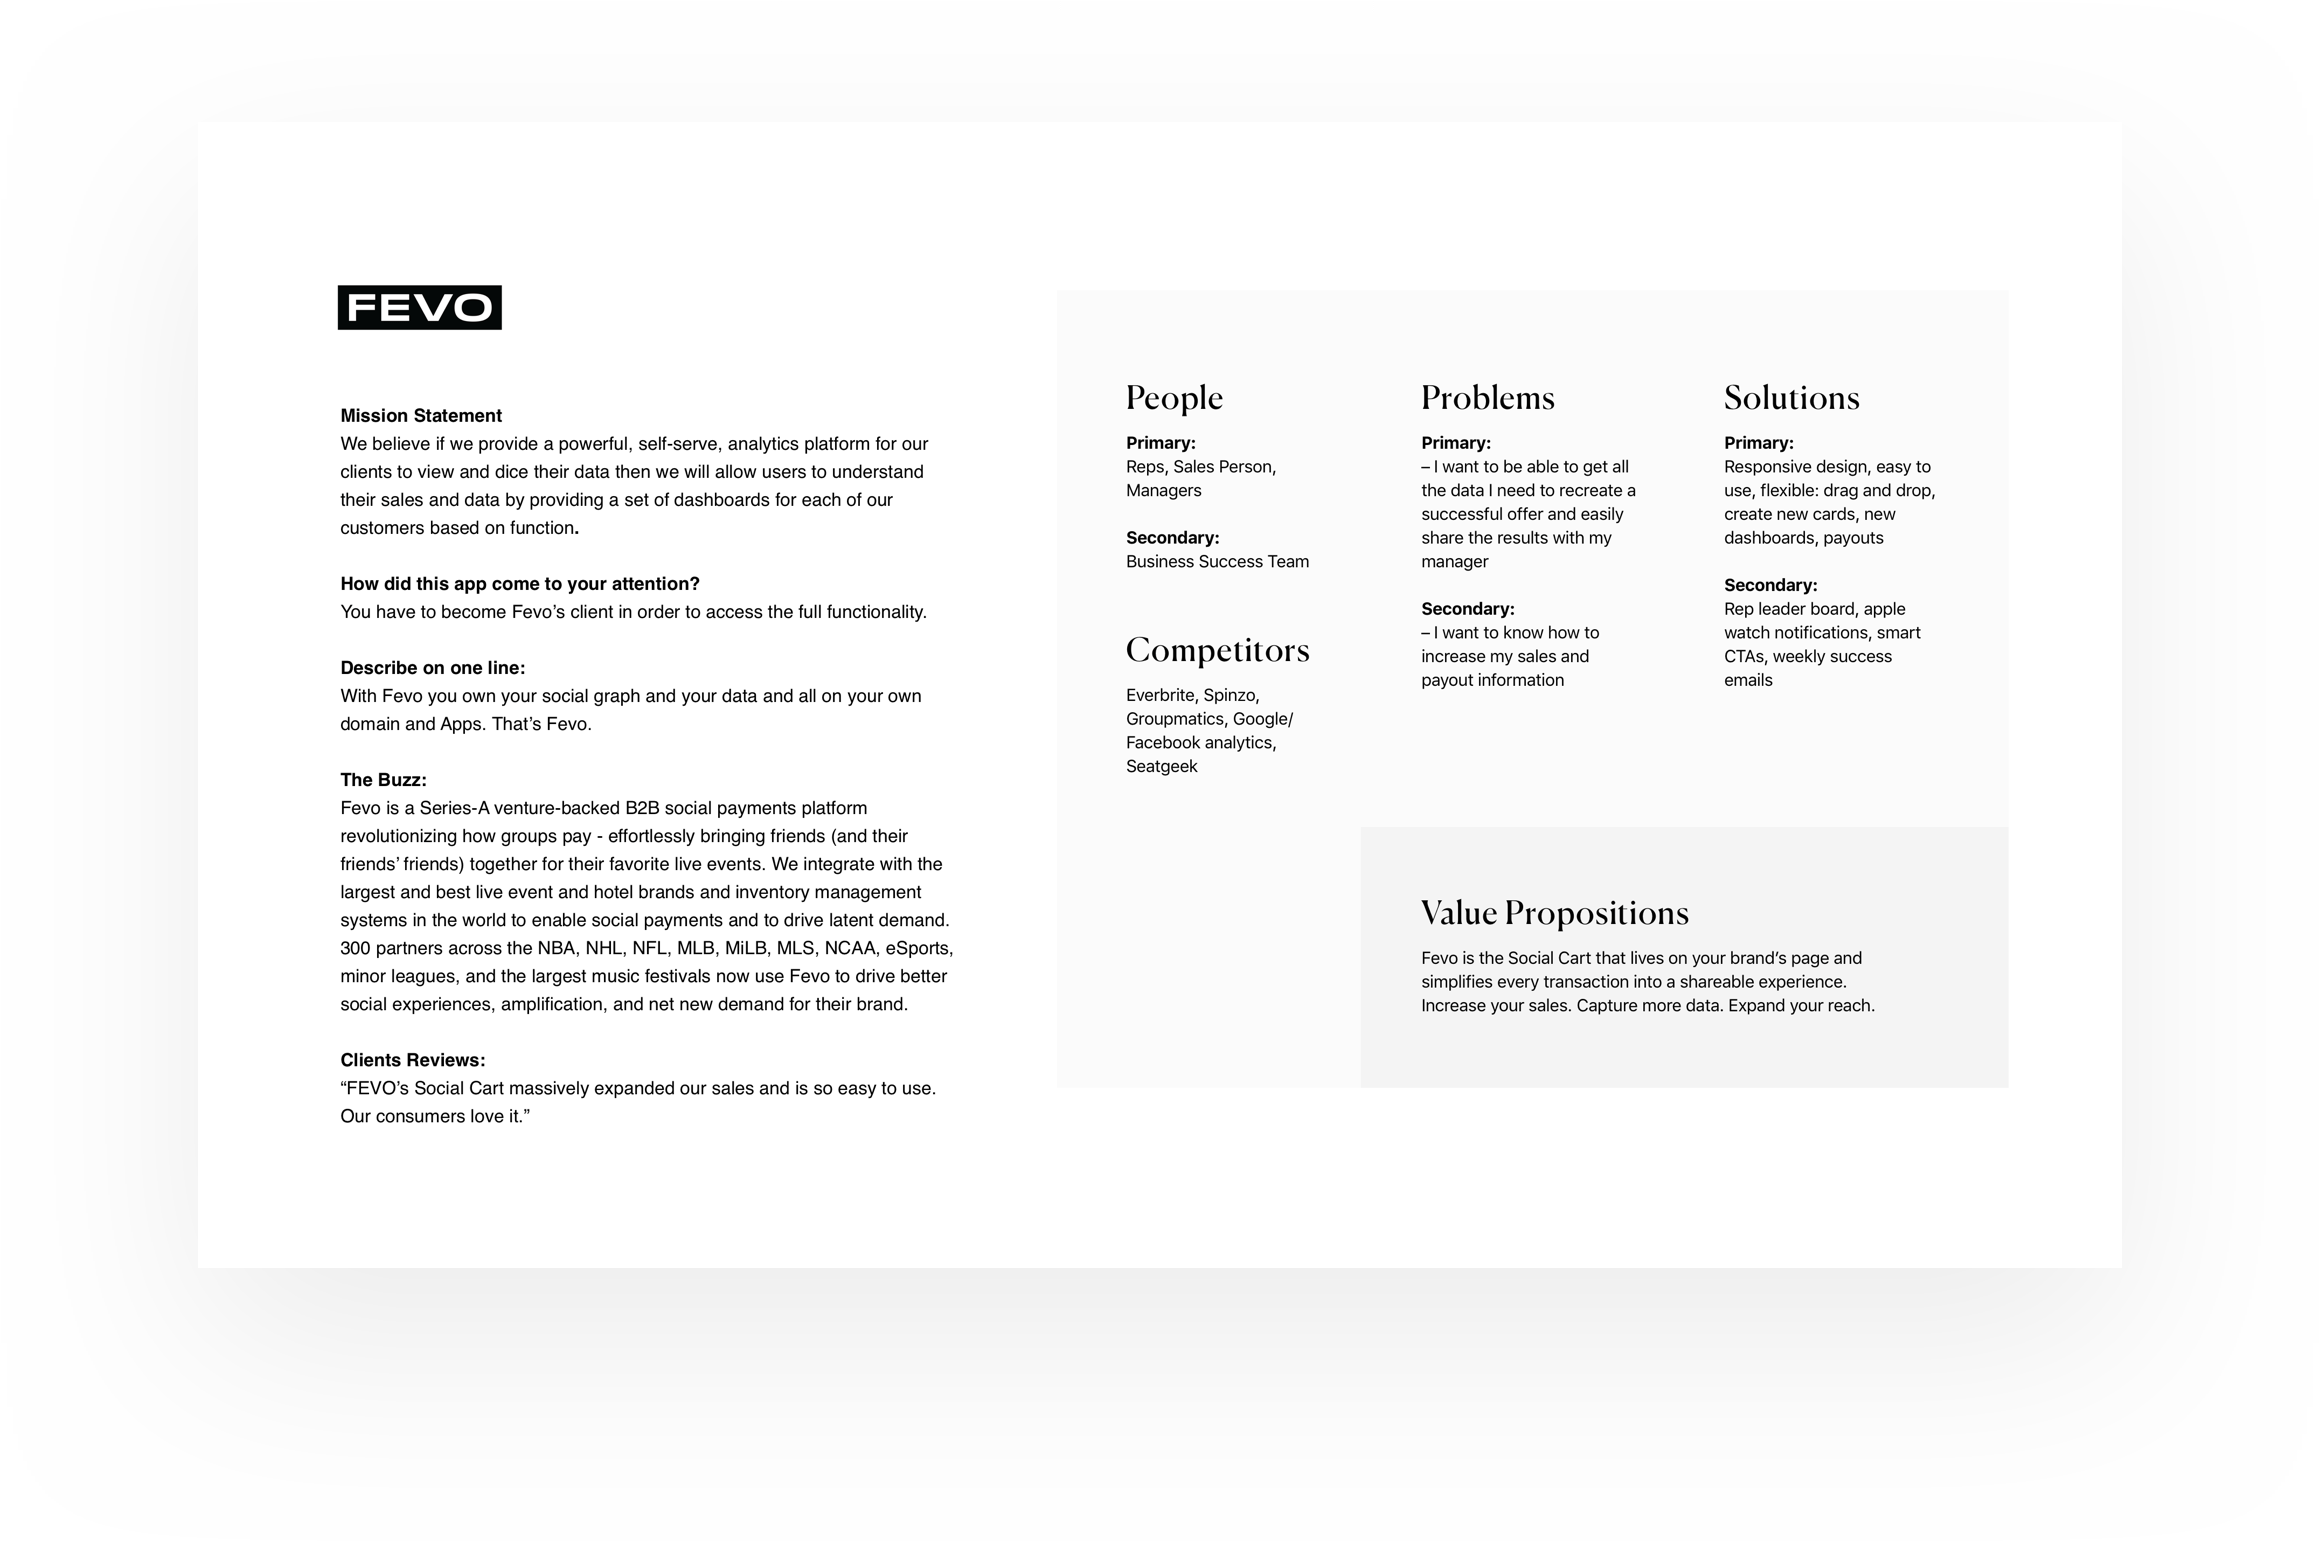
DEFINEValue Proposition Canvas
The Value Proposition Canvas was initially developed by Dr Alexander Osterwalder as a framework to ensure that there is a fit between the product and market. It is a detailed look at the relationship between two parts of the Business Model Canvas; customer segments and value propositions.
I used the Value Proposition Canvas with my team to ensure that our Fevo Analytics is positioned around what the customer values and needs.
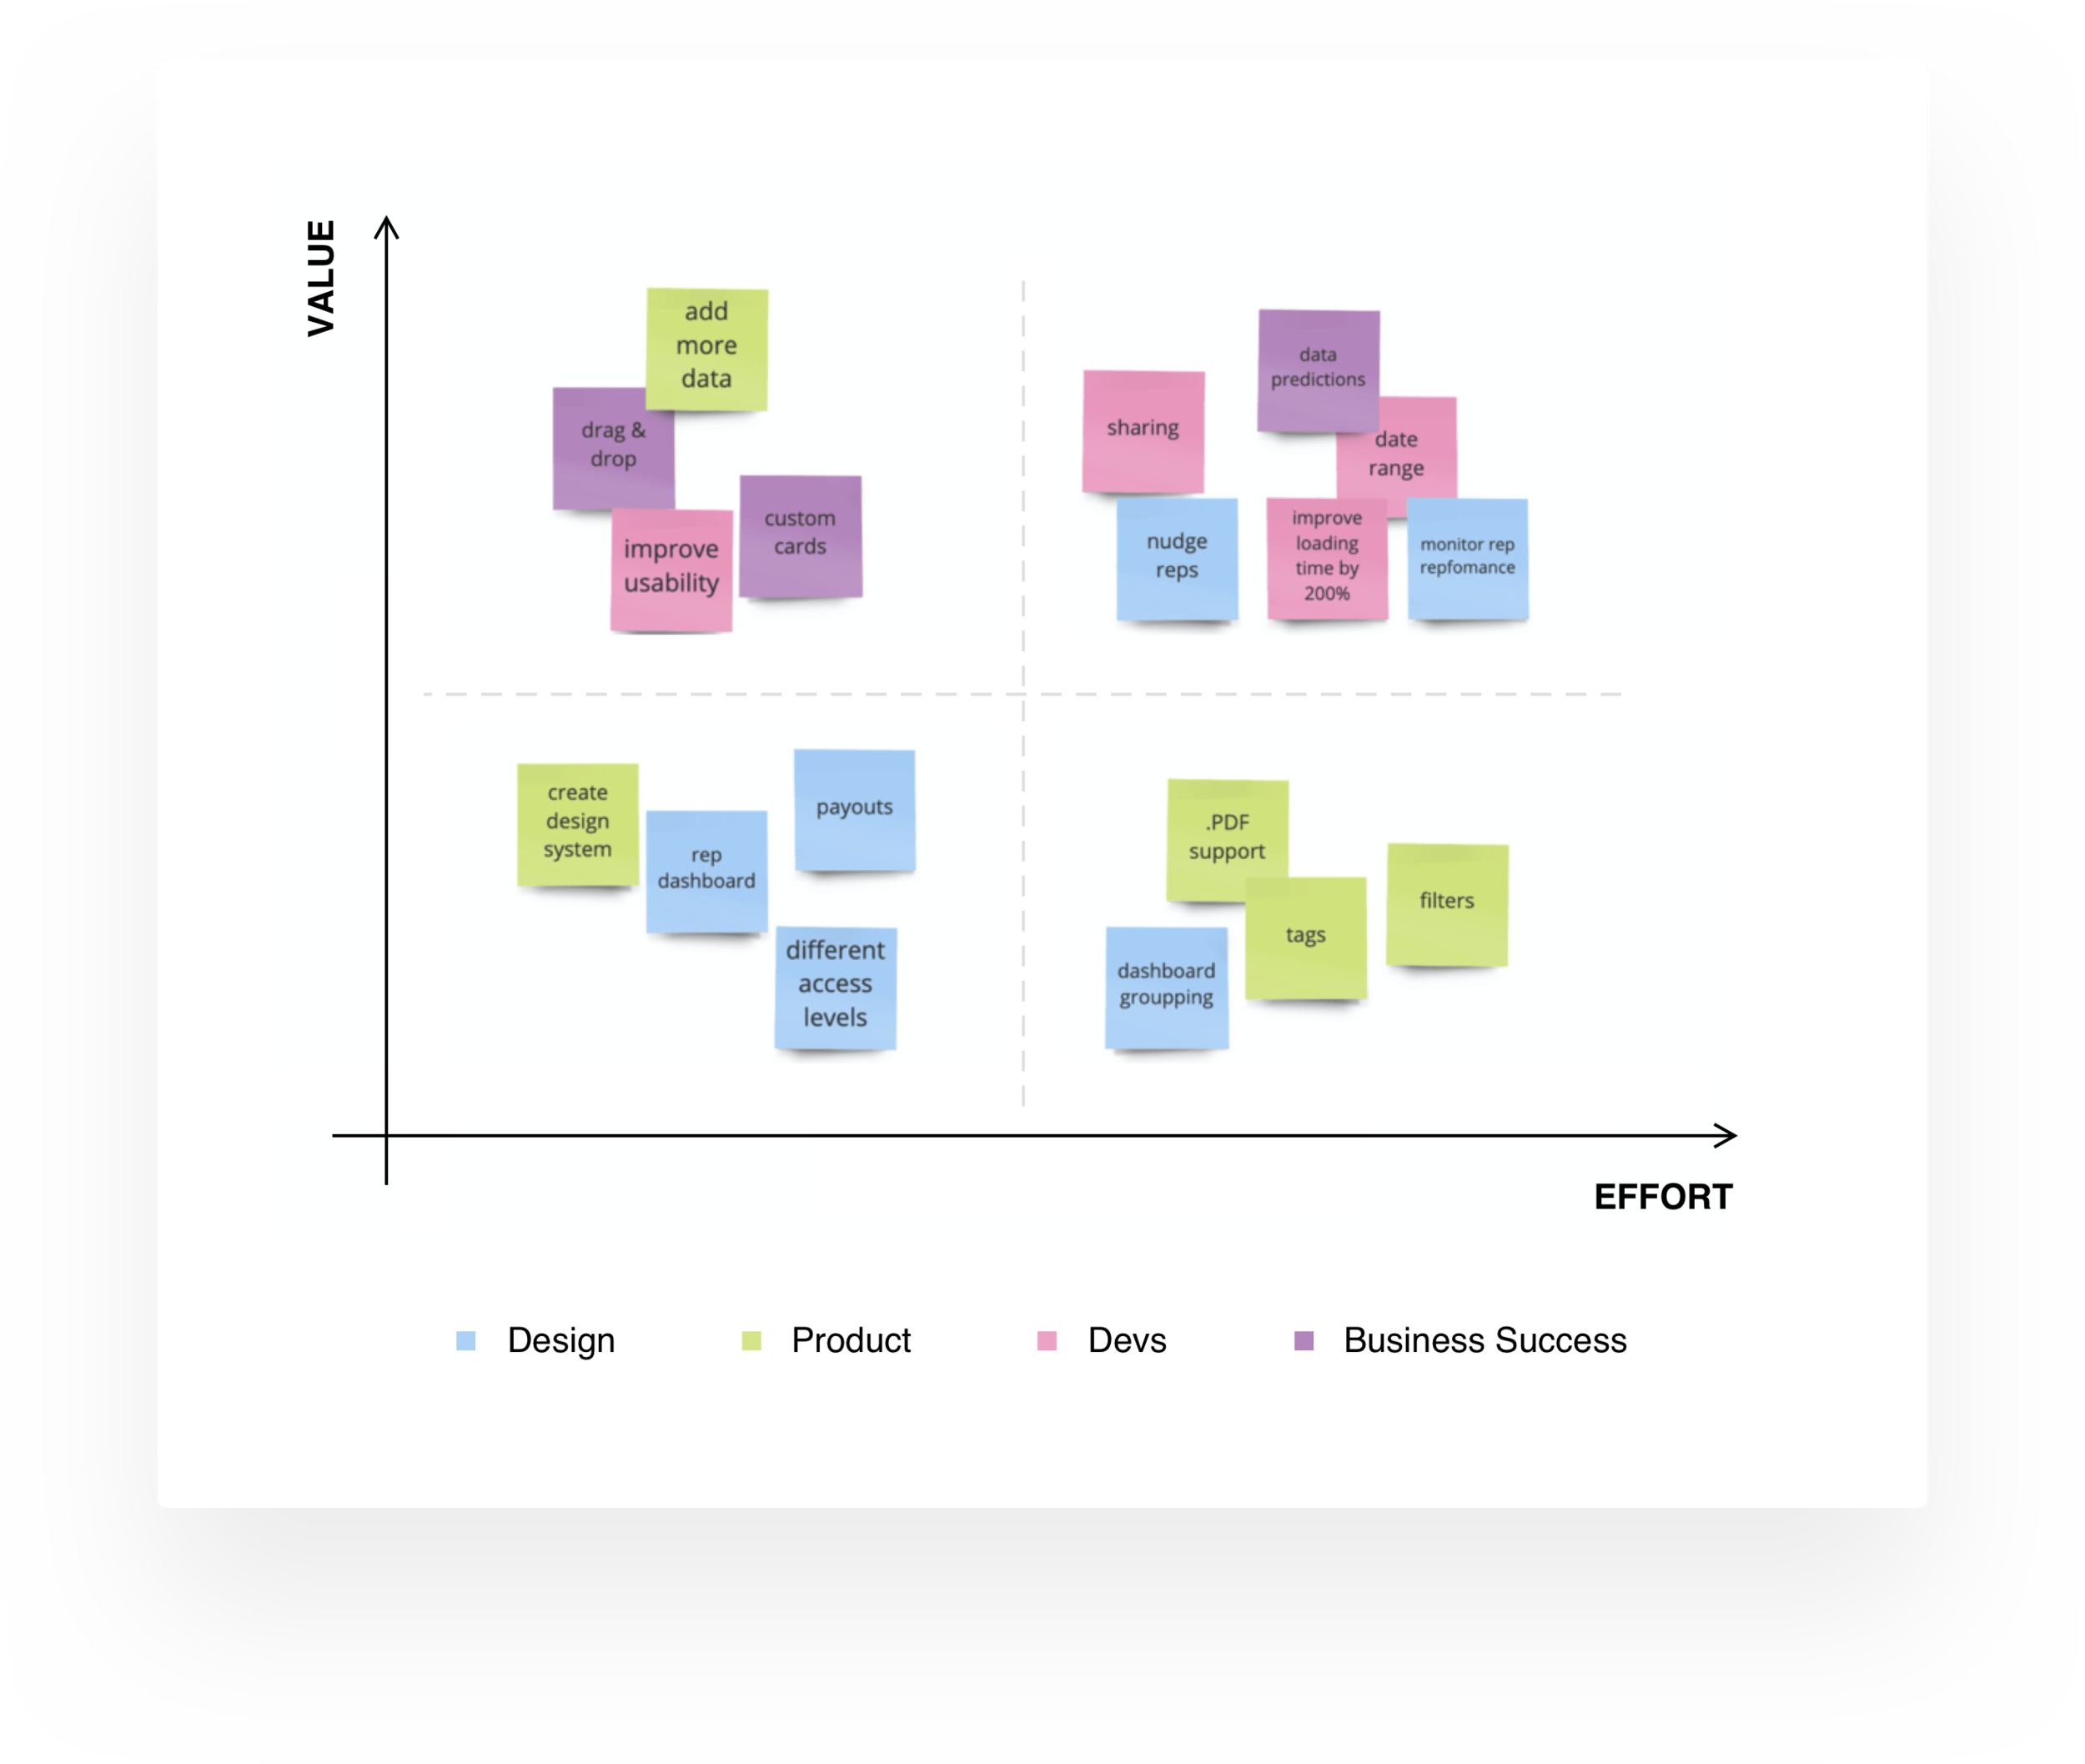
PrioritizationBrainstorming & Timeline
We used NUF approach (Novelty Usable Feasible) to prioritize ideas in consensus with developers, product, business success team, and designers. Value vs Feasibility exercise helped to highlight features we want to deliver in MVP, v1, v2, v3, and plan the timeline. I used the Agile principle and Scrum framework (2-week sprints both for developers and designers). Also, during the process, we had daily standups, retros, sprint reviews, and a positive mindset! :)
Service Design and Service Blueprint will be available in the WeFevo case-study
MetricsMeasurable Results
Before building new Analytics we had a clear idea of how success would look like.
Allow users to view data based on their functions.
Increase usage of analytics feature in Fevo by 50%
Answer the core analytics needs of our clients.
Improve client NPS from 7.4 to 8.4
Reports and Dashboards load within a reasonable amount of time.
Reports should load within 1sec
Visual DESIGNInspiration

Charts Transitions

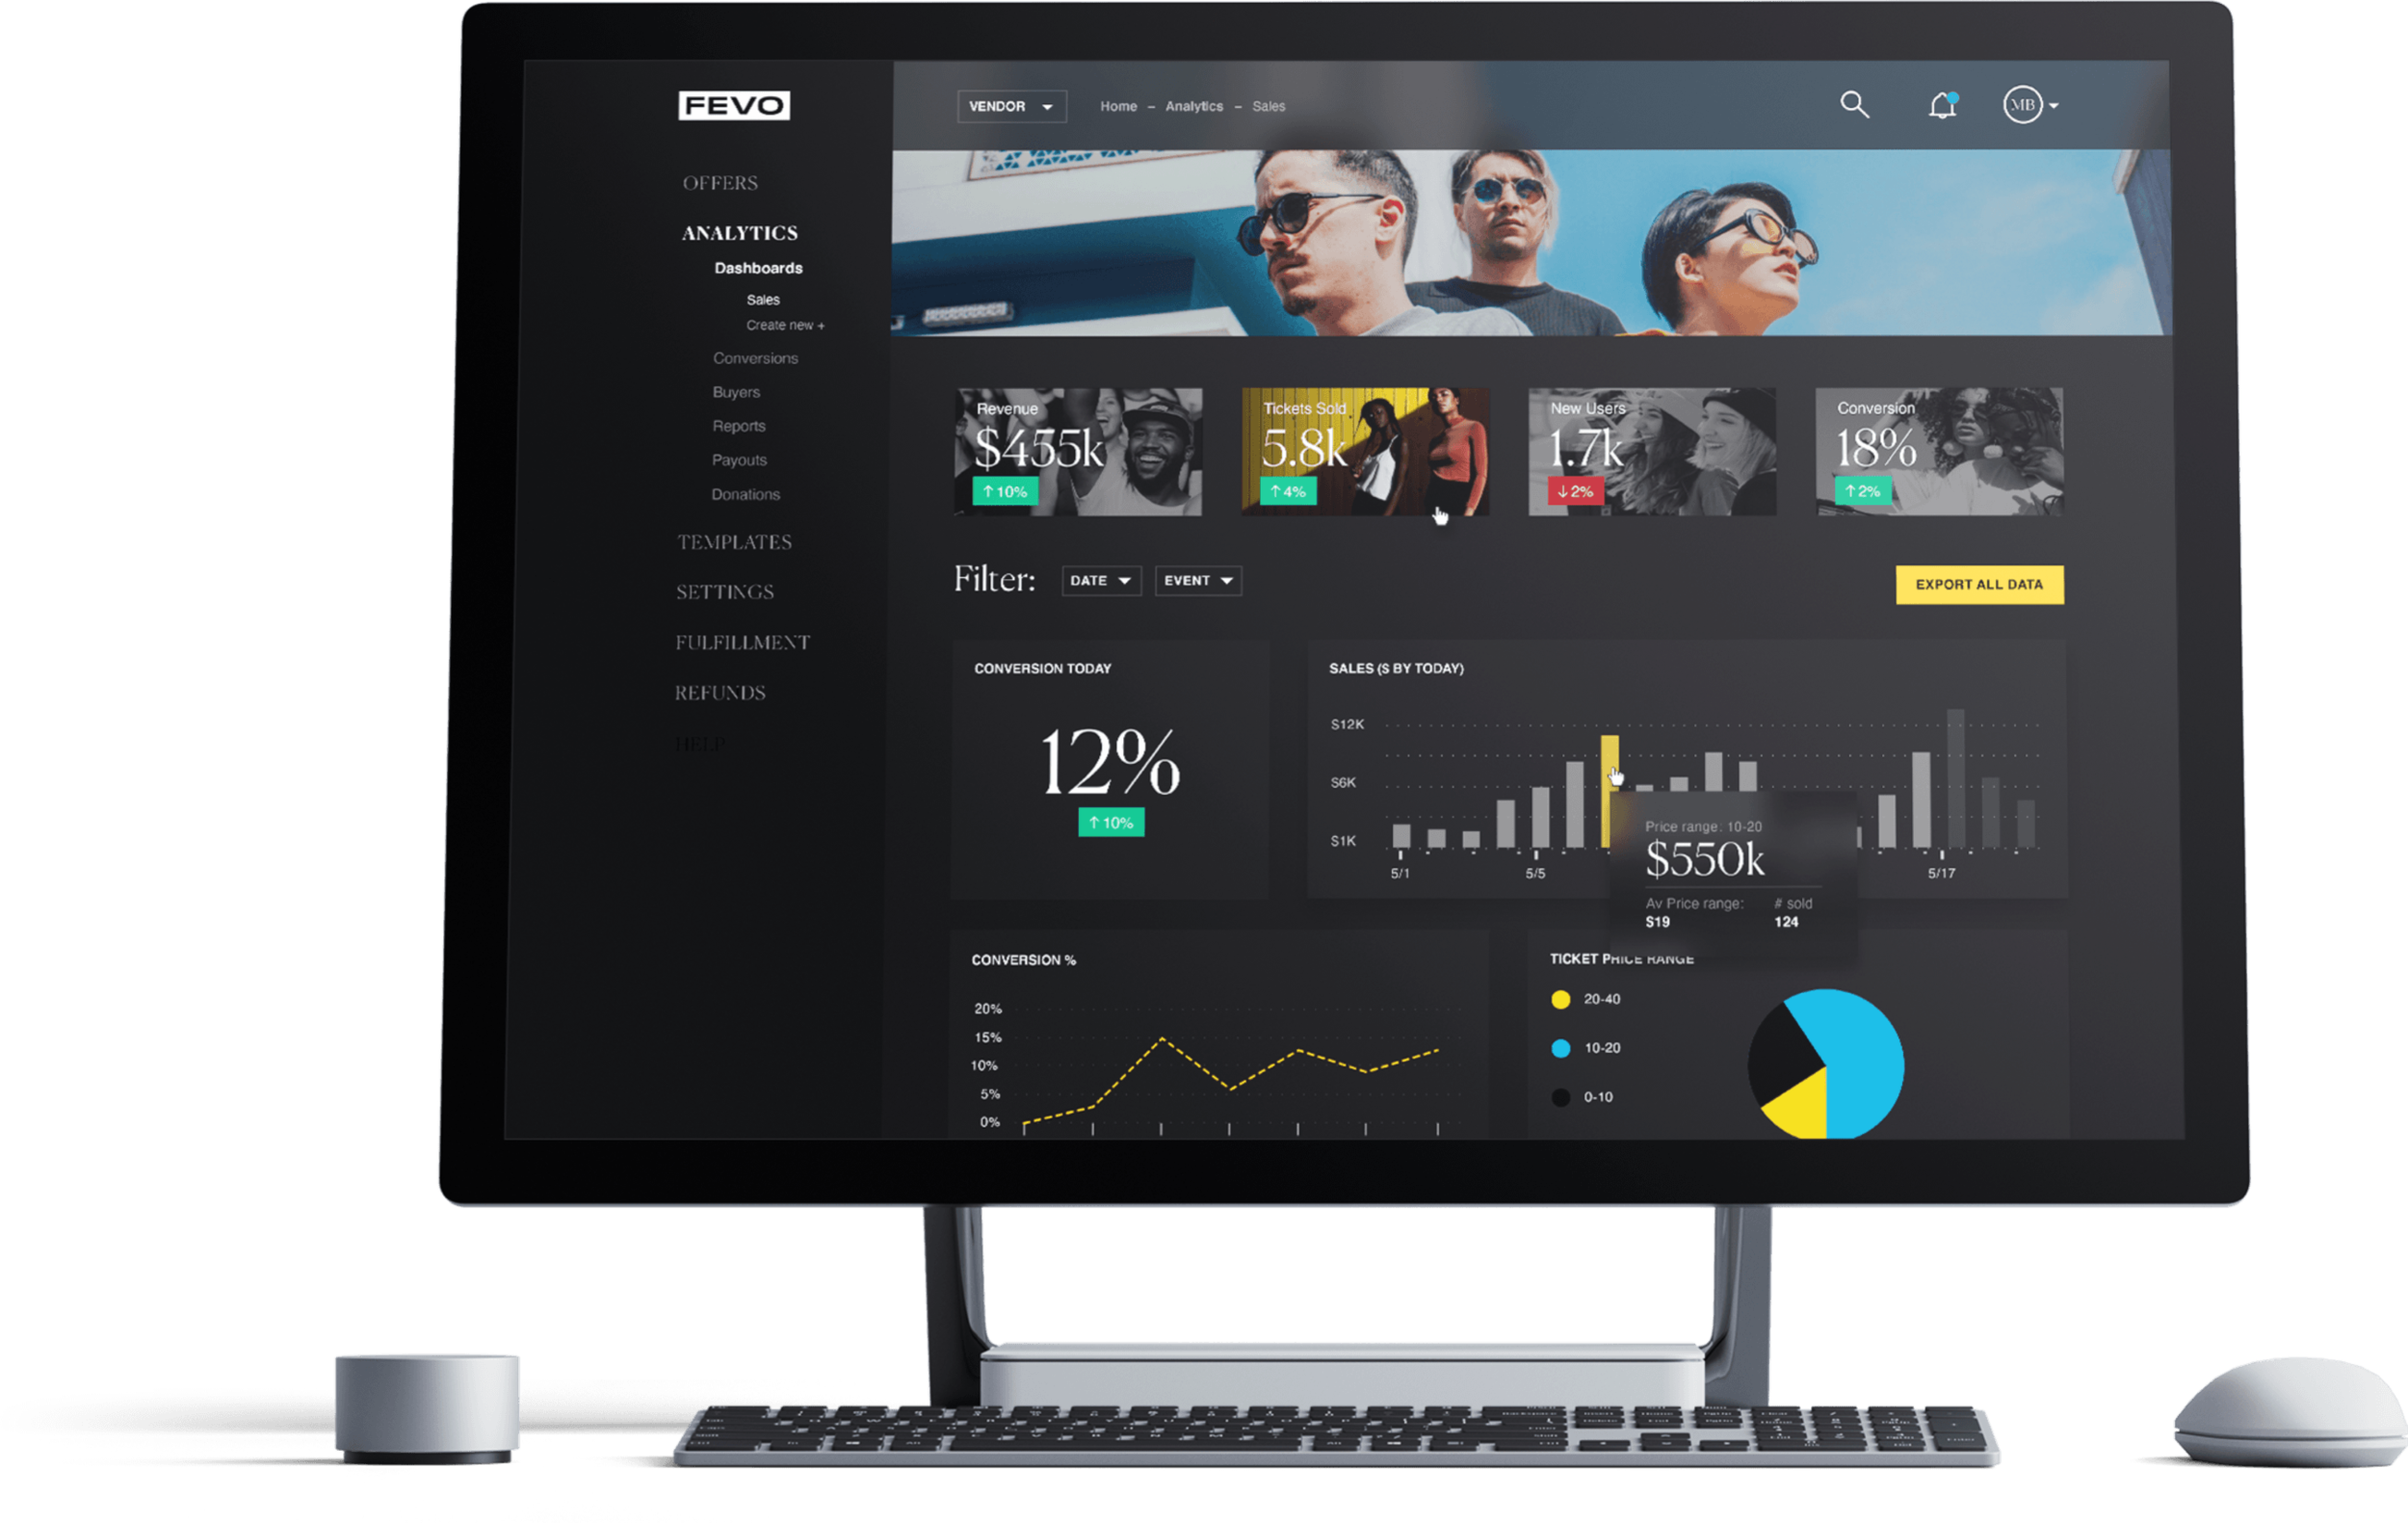
Wireframes, Prototypes, Hi-Fi Designs
Here are some features addressing the client’s problems and needs:
Drag and Drop
Custom Cards
Filters
Create a Dashboard
Rep leaderboard
Export to .pdf, send via email
Notifications
Weekly email
Fast and Responsive
Fevo’s Value Metrics
Mobile Version
Smart CTA
Wireframes

Old Analytics

New Analytics
Analytics was one of the first projects using Design System: “Pancake”.
You can find the case-study here.
